Before the twentieth century, scientists didn’t know that our universe is expanding. The expansion of the universe has been discovered in 1920s and redshift played a key in this great discovery. I show you in this post what exactly redshift is by giving an example. But before explaining redshift, we should two fundamental concepts: black body radiation and spectral lines.
Black body radiation
A black body is defined as an idealized object which absorbs all incident radiation.
The radiation of the object depends only on its temperature. In a given temperature, the amount of electromagnetic radiation emitted by the body, is not equal in different wavelength. The amount of electromagnetic radiation emitted by a black body at temperature  can be found with Planck’s law:
![\[B(\lambda,T)=\frac{2hc^{2}}{\lambda^{5}}\frac{1}{e^{hc/\lambda kT}-1}\]](https://astrodatascience.net/wp-content/ql-cache/quicklatex.com-cf1802dc97bf6a0c24fea6effac19b58_l3.png "Rendered by QuickLaTeX.com")
where,  is spectral radiance,
  is Planck constant,
  is speed of light,
  is Boltzmann constant,
  is wavelength of the electromagnetic radiation, and is absolute temperature of the black body.
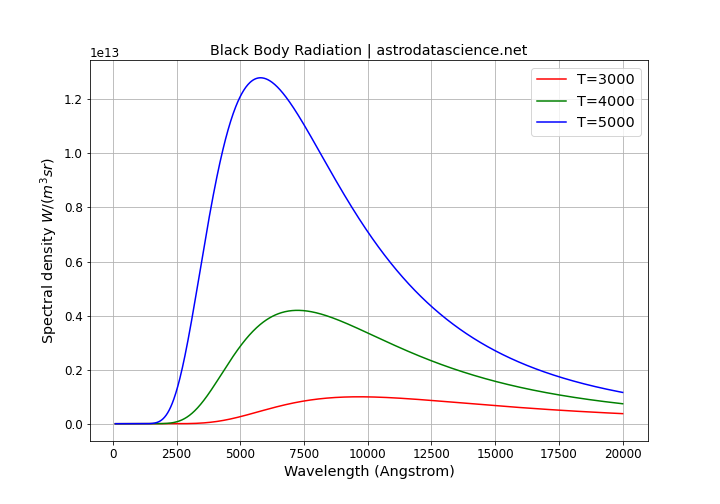
The above chart shows radiation for a black bodies as three different temperatures: 3000 K, 4000 K and 5000 K. You can find here the python code used to create the above chart. There are two important things to note in this picture. First, the amount of radiation emitted by an object in higher temperature is more than the amount of radiation emitted by an object in lower temperature.Second, the peak of the radiation for an object in higher temperature occurs in shorter wavelengths, as compared with an object in lower temperature.
Spectral lines
Stars can be considered as black bodies. We can record the electromagnetic radiation emitted by a star using a spectroscope. The resulting diagram is called spectrum, which shows the amount of emitted radiation in different wavelengths. If you are not familiar with spectroscopy, I recommend these collection of articles on spectroscopy provided by the website of James Webb Space Telescope.
The following picture taken from SDSS SkyServer shows the spectrum of a typical star. You can see two types of deviation from the ideal black body spectrum. First, the noise which can be ignored. Second, there are absorption/emission lines which follow specific patterns and we should not ignore them because there are extremely useful pieces of information in them.
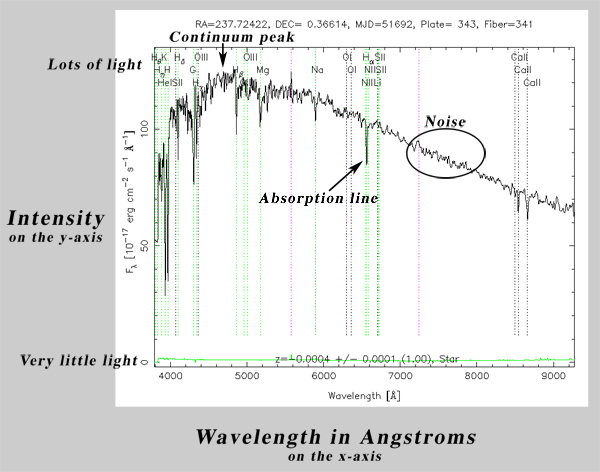
Imagine a star who has a lot of hydrogen atoms in its photosphere. The star emits photons in full range of wavelengths, but the cold hydrogen atoms in the photosphere of star will absorb some of these photos. Photons whose wavelengths equal exactly with energy level difference in the hydrogen atom will be absorbed. So, in the spectrum, we will receive lower amount of light in these wavelengths compared with the nearby wavelengths. The result is appearing of absorption lines which are narrow downward lines in the spectrum. Each line corresponds to a specific energy levels of an atom. If an exited material, such as hydrogen or helium, returns to a lower energy state, it emits photos which will be appeared as emission lines in the spectrum. The emission lines are very common in the spectra of galaxies and quasars.
Redshift
The spectral lines are finger prints that tell us which material, element or molecule, exist in the object. Since we know the exact wavelength of each line, by analyzing the spectrum of a celestial object we can find which materials are there in that object. But that is not all the story. In cosmology, we use the spectra to calculate an interesting quantity, called red shift. Let’s show this with an example.
We want to analyze the spectrum of a galaxy to show you what exactly redshift means. The ID of the galaxy in the SDSS catalog is 320932083365079040. We can simply use sdss python package with the following code to view the spectrum.
import sdss

sp = sdss.SpecObj(320932083365079040)

sp.show_spec()
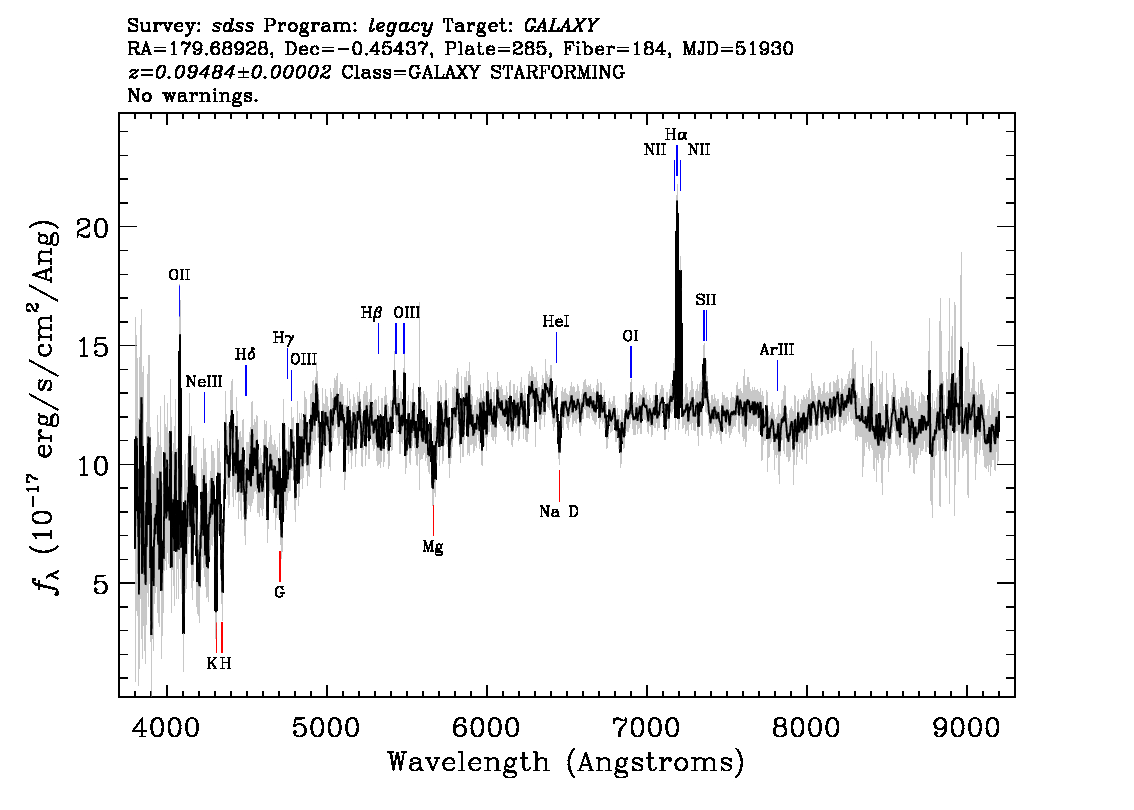
In the middle right of the spectrum, you can see a strong upward emission line which is called  line. This line appears when electron in hydrogen atom transits from the third to the second energy level. The difference between these two energy levels is 1.89 eV which corresponds to a wavelength of 6564.614 Angstrom. But as you see in the picture, the line is not there. It is at 7187.401 Angstrom. For a better analysis, I have created the same spectrum in the following picture to concentrate our attention only on the line. You can find the source code used to creating the spectrum here.
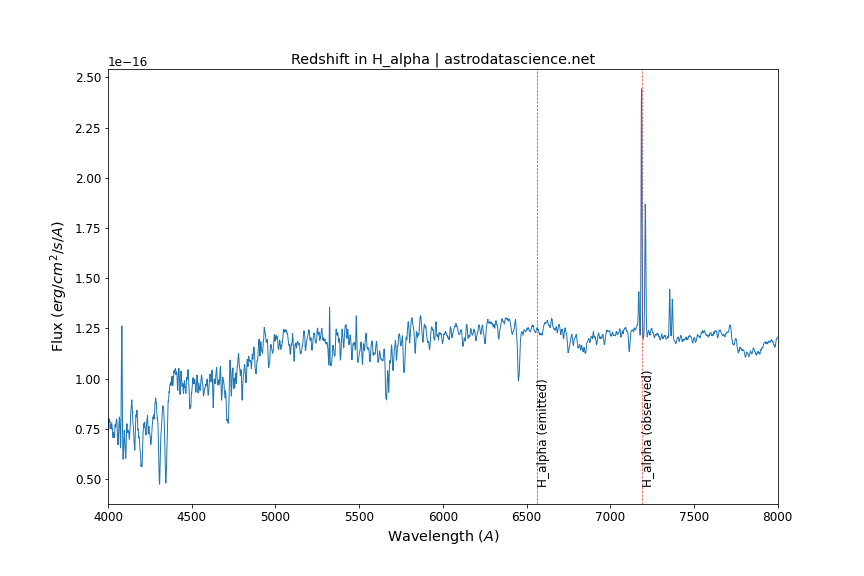
The blue dashed line in the above picture, labeled as emitted, shows the original wavelength of . If you analyse the spectrum of a material in a laboratory on Earth, the line should be there. But in the sky everything can be different! Since the galaxy is moving away from us, the light that we receive from it, is subjected to Doppler effect. According to Doppler effect, if an object is moving away from us, we will receive its light in longer wavelengths. This is why the has shifted from 6564.614 Angstrom to 7187.401 Angstrom. The first number is the observed wavelength often denoted as  and shown in the picture with the vertical blue dashed line. The second number is the emitted wavelength often denoted as
  and shown in the picture with the vertical red dashed line. Redshift, denoted by the letter
  , is defined as follow:
![\[ z = \frac{\lambda_{obs} - \lambda_{emit}}{\lambda_{emit}} \]](https://astrodatascience.net/wp-content/ql-cache/quicklatex.com-d441ac73bc0c88a2e8d4487dda6507b0_l3.png "Rendered by QuickLaTeX.com")
Applying this formula to our example, we can find the redshift:
![\[ z = \frac{7187.401 - 6564.614}{6564.614} = 0.095 \]](https://astrodatascience.net/wp-content/ql-cache/quicklatex.com-6763e2501f1e455c3e1865e4fbfa2d15_l3.png "Rendered by QuickLaTeX.com")
For an object which is moving away from us, the redshift is positive and for an object which is approaching us, the redshift is negative. The velocity of the object relative to us, can be easily found by multiplying its redshift by the speed of light:
![\[ v = c \times z \]](https://astrodatascience.net/wp-content/ql-cache/quicklatex.com-66c681a1cf278288c29c650eb1fdaf6e_l3.png "Rendered by QuickLaTeX.com")
Applying the formula to the galaxy of our example:
![\[ v = 299792458 \times 0.095 = 28480283.51 \]](https://astrodatascience.net/wp-content/ql-cache/quicklatex.com-73081aeff22cecfc9a76267146b3dfe2_l3.png "Rendered by QuickLaTeX.com")
So, this galaxy is moving away from us with a speed about 28480 km/s.
Redshift and scale factor
When we look at the sky, we are looking at the past. Cosmologists usually use redshift to indicate a moment in the cosmological time, or a distance in the space. When we say  , we are indicating a moment at which, an object with this redshift has emitted the light that we are receiving now. At the same time, we are indicating its position relative to use, caused by the expansion of the universe.
There is a closely related concept that appears in the cosmological model, called scale factor. Let me explain it with an example. If we consider our distance to a galaxy to be 1 unit at the present time, at a certain moment in the future, our distance will be 1.5 unit because of the expansion of the universe. Similarly, the was a moment in the past, when our distance wan 0.5 unit. In the first case, the scale factor is 1.5 and in the second case it is 0.5. The scale factor at the present time is 1.
The relation between redshift and scale factor is given by the following formula:
![\[ 1+z = \frac{1}{a} \]](https://astrodatascience.net/wp-content/ql-cache/quicklatex.com-f31de1827661f33e46fd52baa7b8e696_l3.png "Rendered by QuickLaTeX.com")
Applying to our example:
![\[ a = \frac{1}{1+0.095} = 0.913 \]](https://astrodatascience.net/wp-content/ql-cache/quicklatex.com-84fc9b8e3c1a9f5c7895aad47e062ce2_l3.png "Rendered by QuickLaTeX.com")
It means the the light we’ve received from the galaxy, has been emitted by the galaxy at a moment when the scale factor of the universe was 0.913.
Redshift and distance
According to Hubble’s law, there is a linear relation between the recessional velocity of an object, caused by the expansion of the universe, and its distance. In other words, galaxies are moving away from each other at a speed proportional to their distances.
![\[ v = H_{0}D \]](https://astrodatascience.net/wp-content/ql-cache/quicklatex.com-f74c84aa7bbb81e301b73deaf3d2da2d_l3.png "Rendered by QuickLaTeX.com")
In the above formula,  is the recessional velocity,
  is the proper distance, and
  is Hubble’s constant. According to Planck Mission final results, released in 2018, the value of Hubble’s constant is 67.66
  . It means that if a galaxy is at 1
  away from us, it is moving away from us at speed of 67.66
  . Replacing in the above formula with
  , as we’ve seen before, we will find the relationship between redshift and proper distance:
![\[ c z = H_{0}D \]](https://astrodatascience.net/wp-content/ql-cache/quicklatex.com-b513f27ee61103d02663cc0dfce3ba26_l3.png "Rendered by QuickLaTeX.com")
Applying to the galaxy of our example, we can find it’s distance:
![\[ D = \frac{c \times 0.095}{H_{0}} = 420.932 Mpc \]](https://astrodatascience.net/wp-content/ql-cache/quicklatex.com-d244f4bea77478ccb86b431e0a86890f_l3.png "Rendered by QuickLaTeX.com")
Cool! Let’s review what we’ve done. First, we calculated the redshift with comparing the observed wavelength of line with it’s rest wavelength as we knew before. We found that the redshift of the galaxy is 0.095. Then, we calculated its recessional velocity to be 28480 , meaning that it is moving away from us at this speed. Finally, by calculating it’s proper distance, we found that it is at 420.932 , or 1.373 giga light years, away from us.